How to Make Daily Activity Report in Excel (5 Easy Examples)
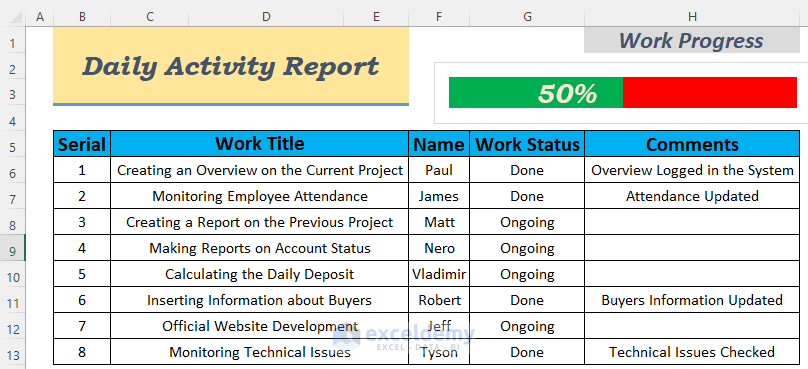
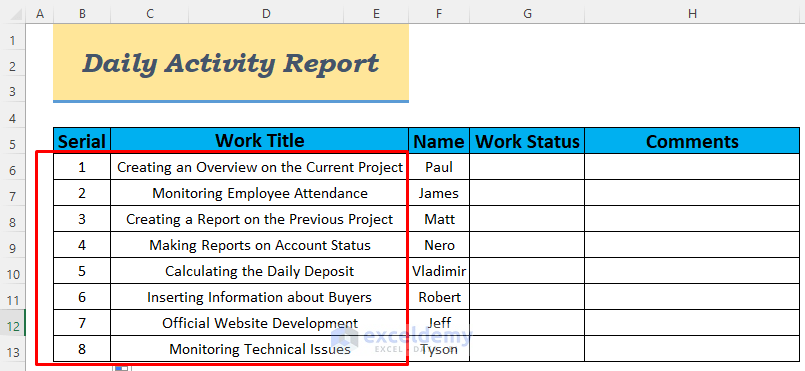
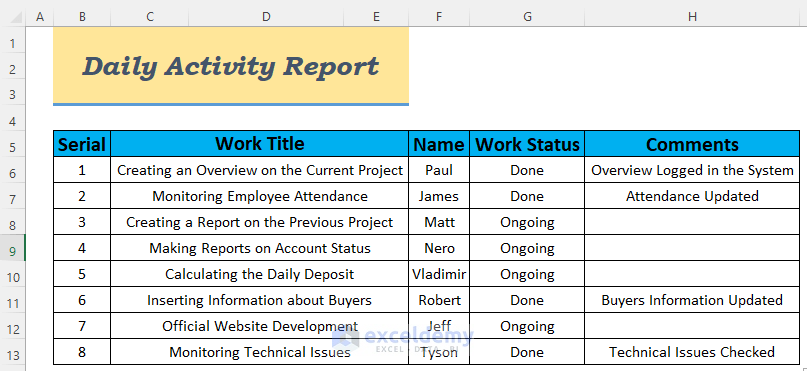
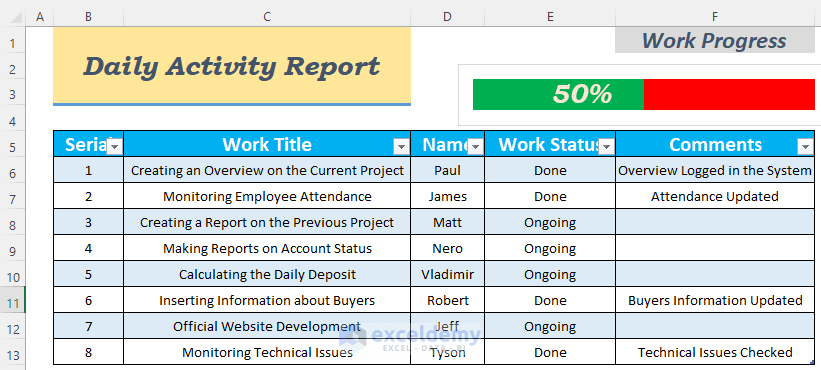
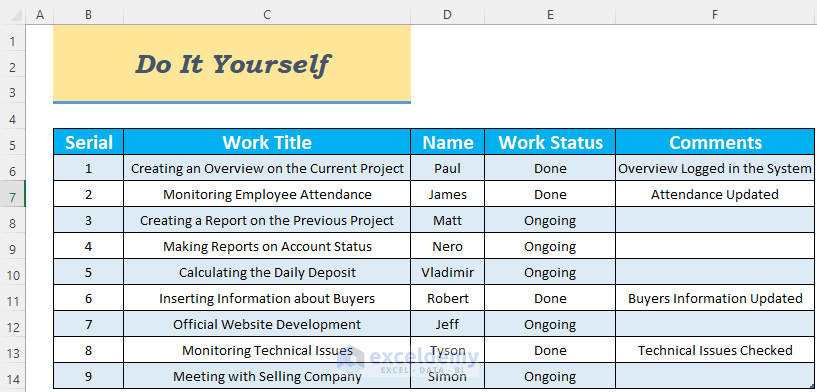
Here’s an example of a daily activity report for a company. We’ll create templates similar to the one shown in the image, which you can modify later.
How to Make a Daily Activity Report in Excel (5 Easy Examples)
Example 1 – Making a Daily Activity Report in Excel to Understand the Work Progress
- Use the following formula in cell B6.
=IF(C6="","",ROW()-5)
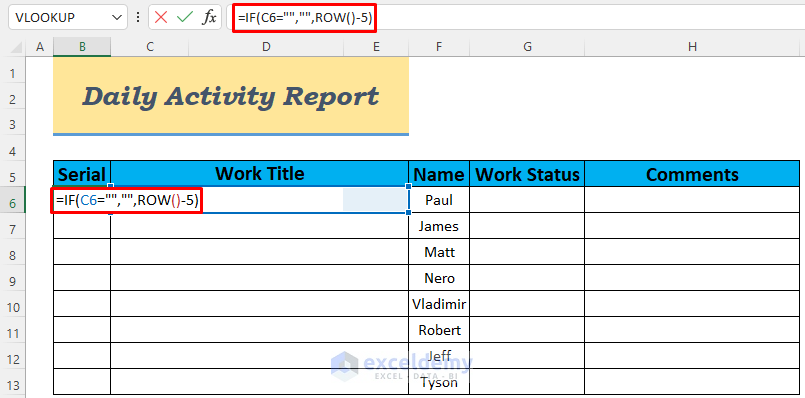
This formula puts a serial number for each work project automatically.
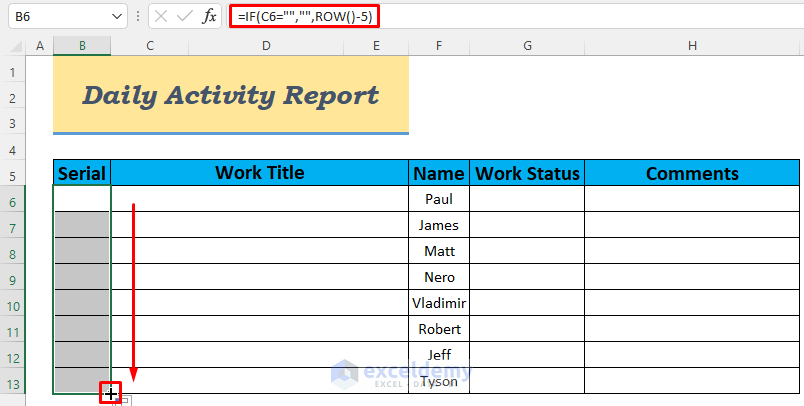
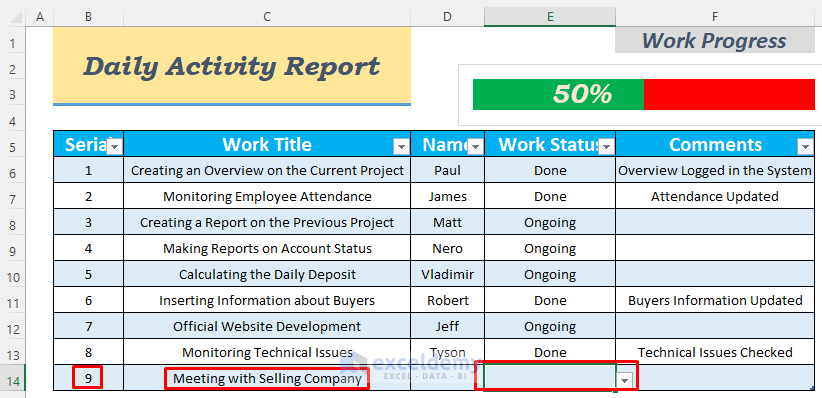
- Put an entry in the first cell of the Work Title. You will get 1 in cell B6.
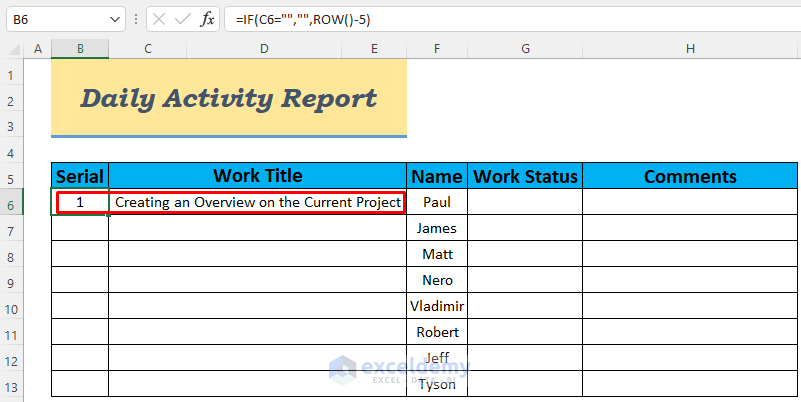
- Enter all the other work entries in the D column and you will see all the Work Titles are marked with a serial.
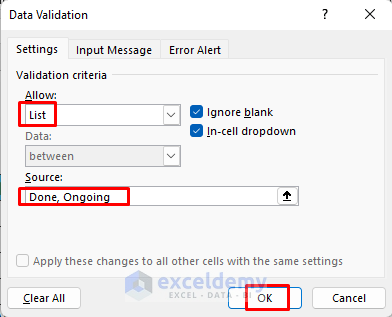
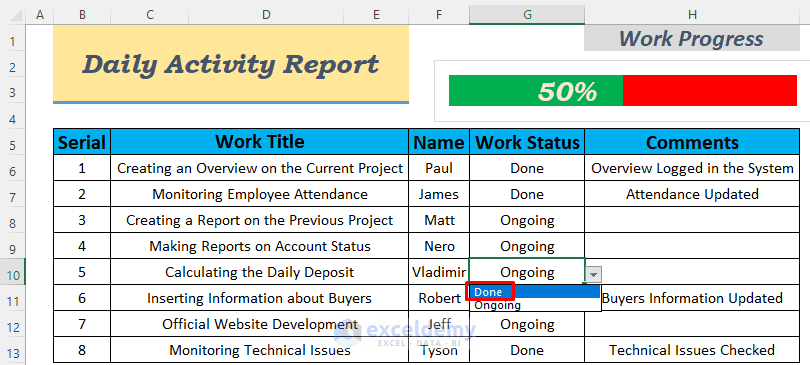
- You will see a drop-down icon in cell G6. Use the Fill Handle to AutoFill the column. This will create a drop-down list in each cell of column G.
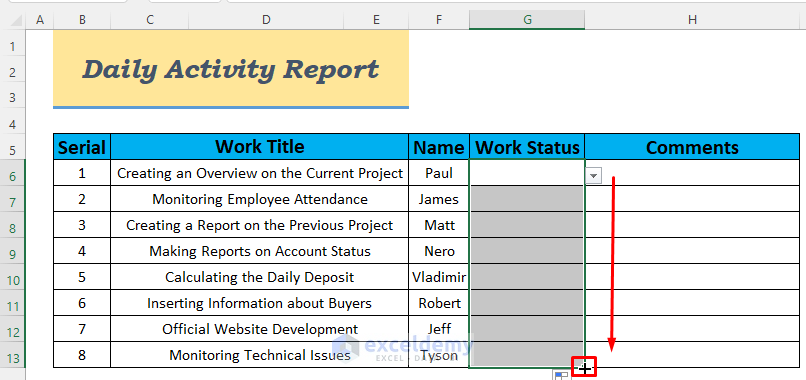
- You can see the options Done and Ongoing if you click on the drop-down icon.
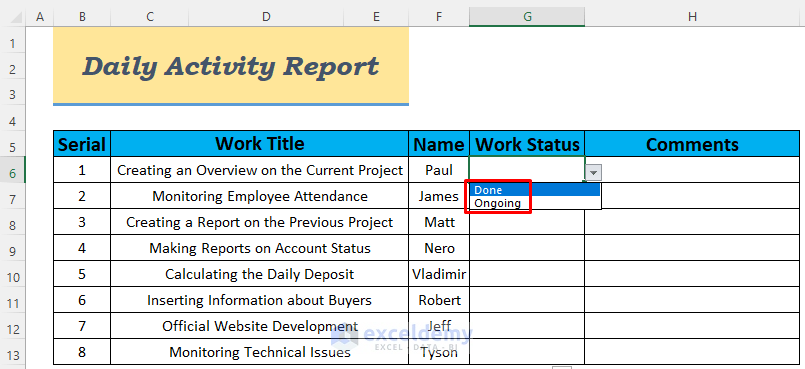
- Choose the entries as you wish.
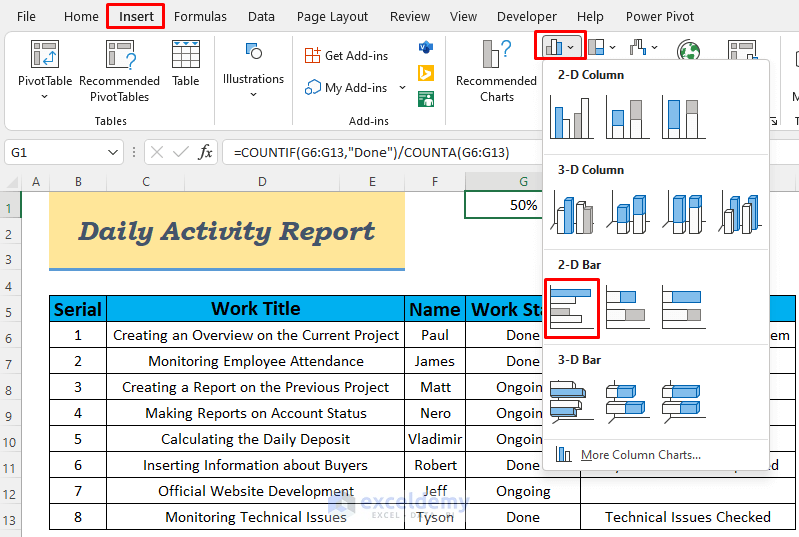
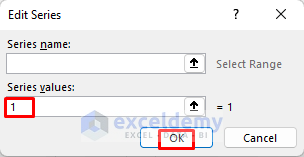
- To see the percentage of work done, use the following formula in a cell outside the main dataset, such as G1.
=COUNTIF(G6:G13,"Done")/COUNTA(G6:G13)
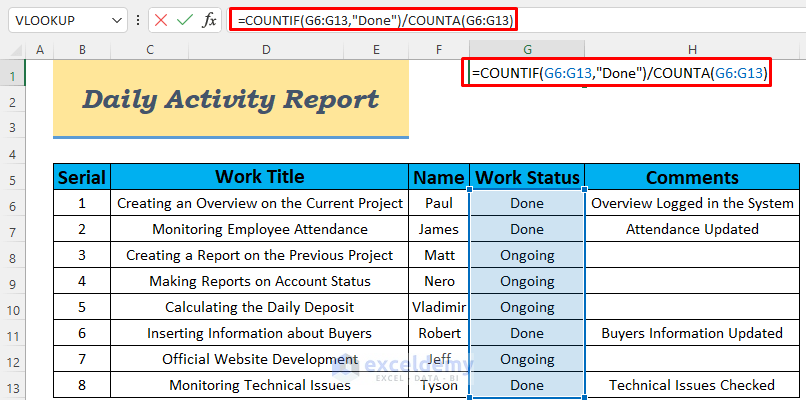
The COUNTIF Function will count the number of times “Done” is present in the Work Status column. The COUNTA Function will count the number of cells through the range G6:G13. After dividing, we will get the fractional value of the ratio between work done and total work.
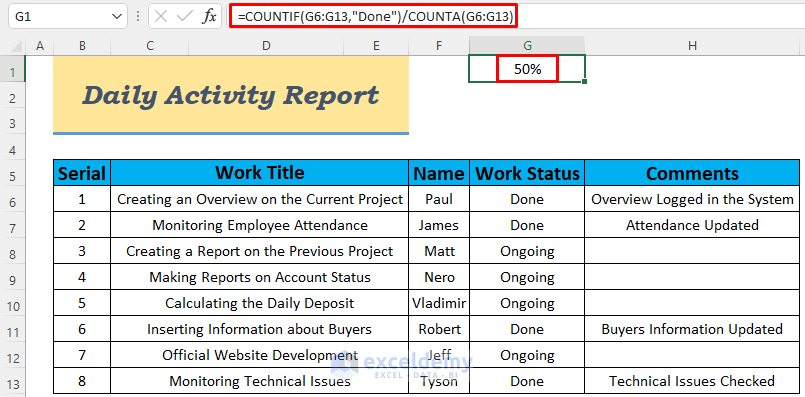
- Hit Enter and you will see the percentage of work done in that cell.
- To see the value as a percentage, go to the Number ribbon and select Percentage.
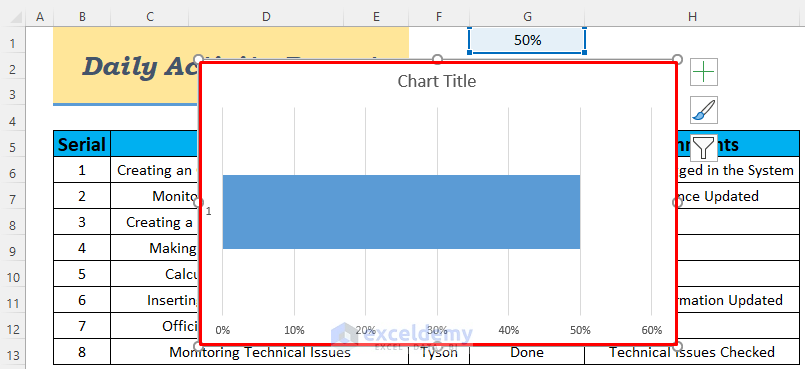
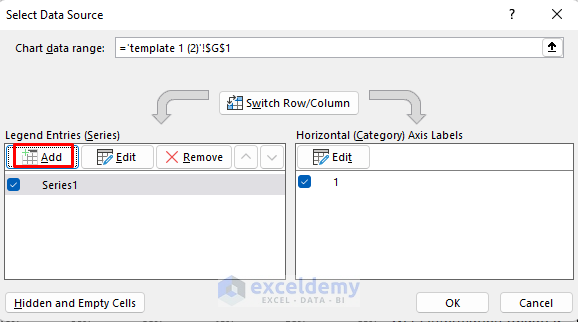
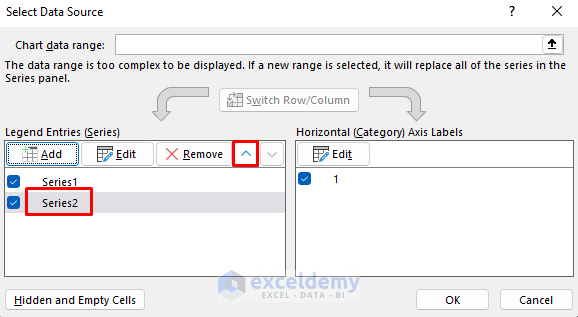
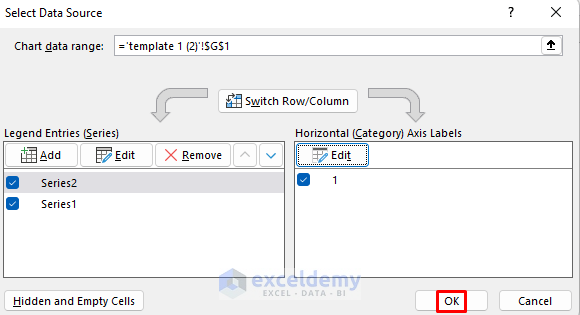
- Move up Series2 by clicking on the up arrow icon next to Remove.
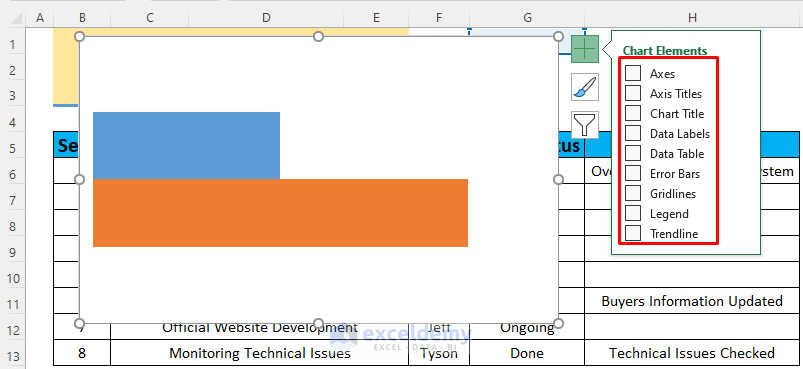
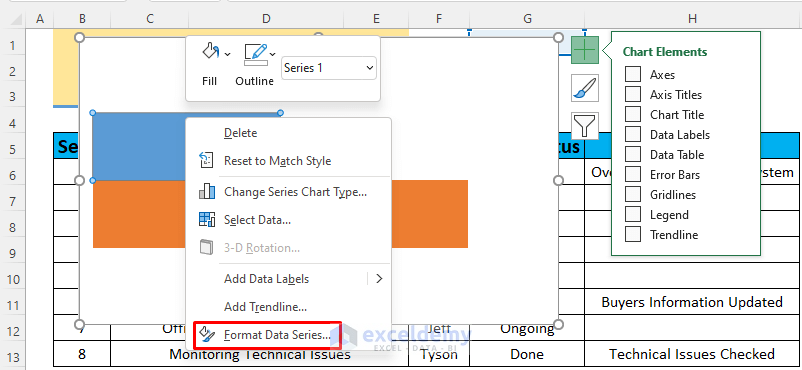
- Resize the bar and drag it where you want it.
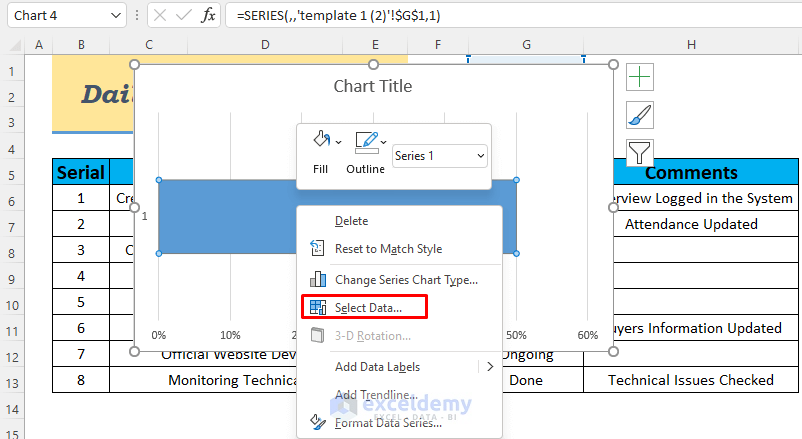
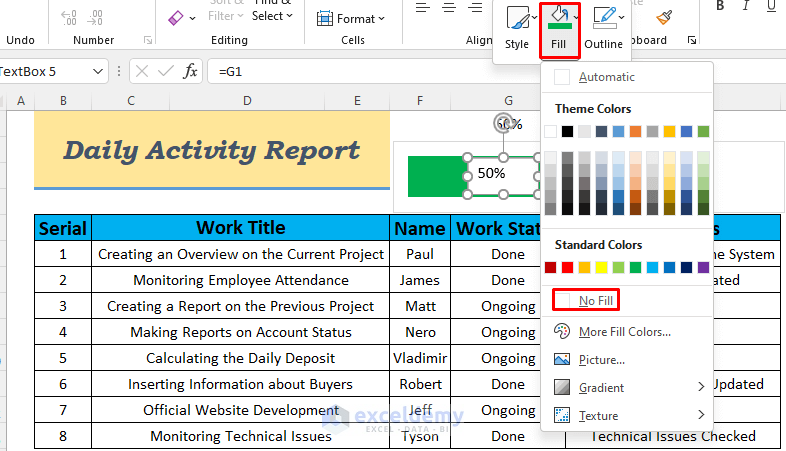
- Right-click on the blue part of the bar and select Fill, then choose a color you want.
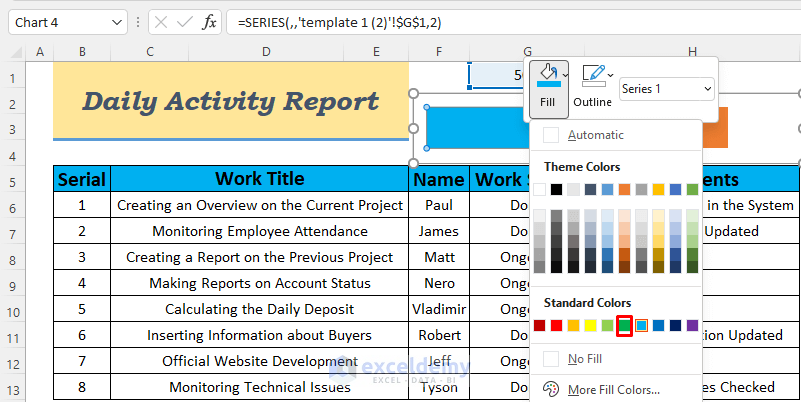
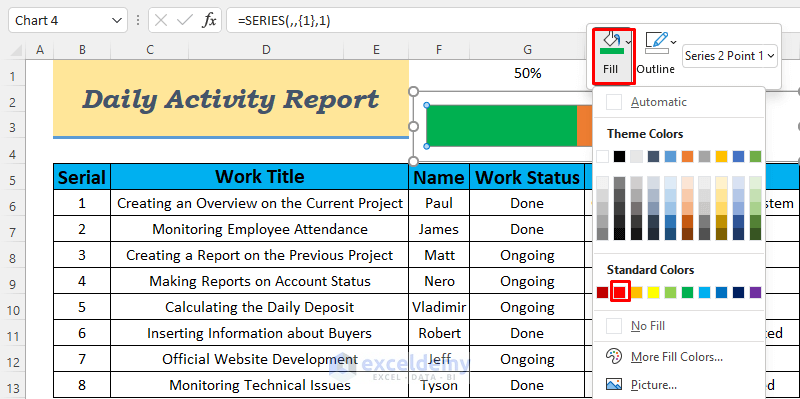
- Set a color for the left part of the bar. The green part of the bar represents the fraction of work done.
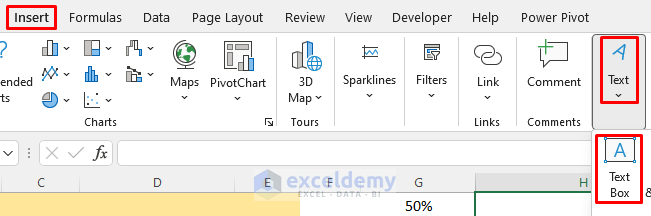
- Put the Text Box over the bar in the chart and select it. Insert the following formula in the formula bar.
=G1
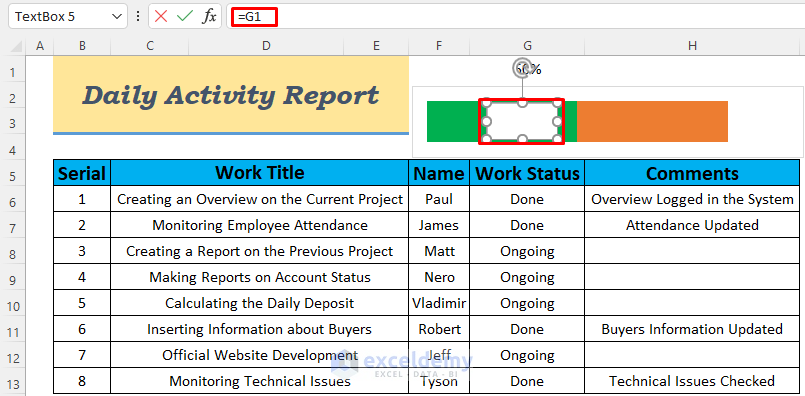
This formula will provide the value of the percentage of work done in the Text Box. We stored the result in cell G1, so we’ll put its reference in the Text Box.

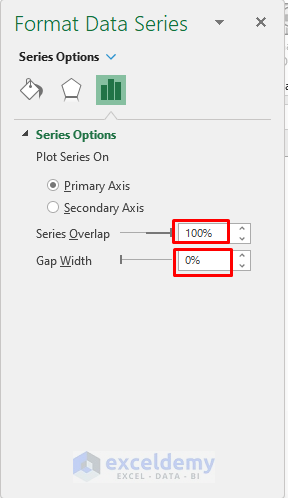
- Format and set the orientation of the bar according to your preference.
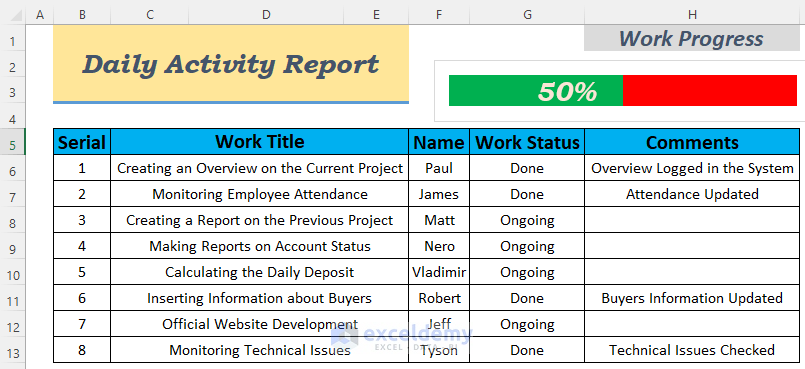
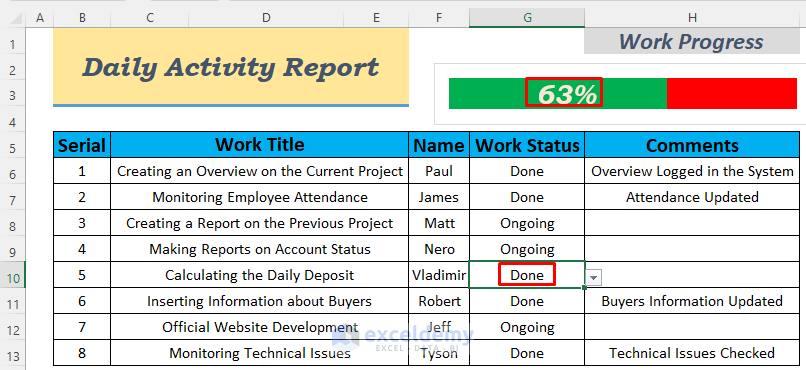
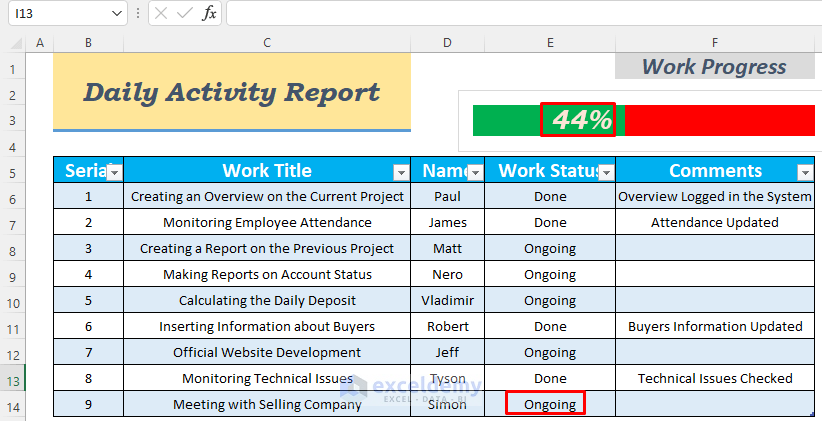
- If you change any of the work statuses, you will see the percentage change in the bar.
There are 5 tasks done out of a total of 8, which means 62.5% of the work is done. See it in the following figure. As we take the rounded percentage, you will see 63% in the bar as a result.
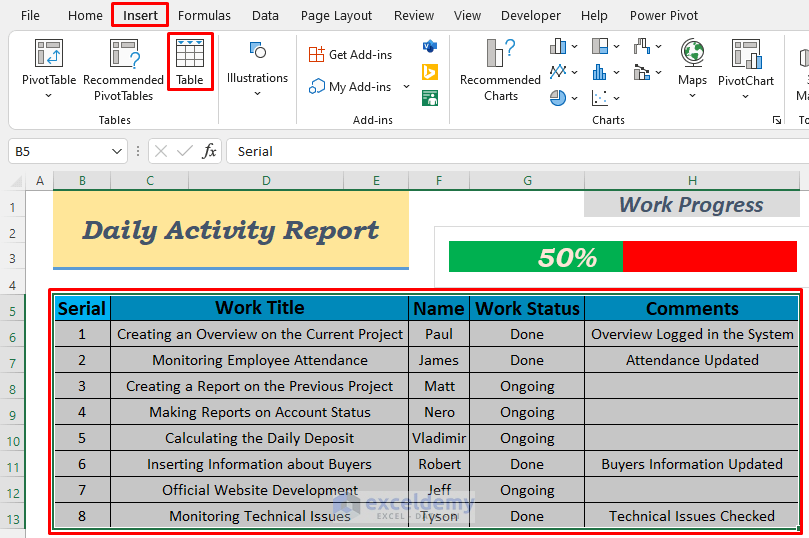
Example 2 – Using an Excel Table to Make a Daily Activity Report in Excel
We’ll make the template from Example 1 as a table. Let’s go through the process below.
Steps:
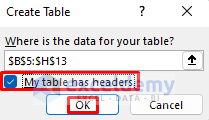
- A dialog box will show up. Check My table has headers and click OK.
- You will see the template converted to a table.
- Insert a new entry, it will automatically create the serial number and a drop-down list for work status.
Example 3 – Making a Daily Activity Report in Excel for Sales Management
We’ll create a table for the daily report on sales and quantity sold by an organization
Steps:
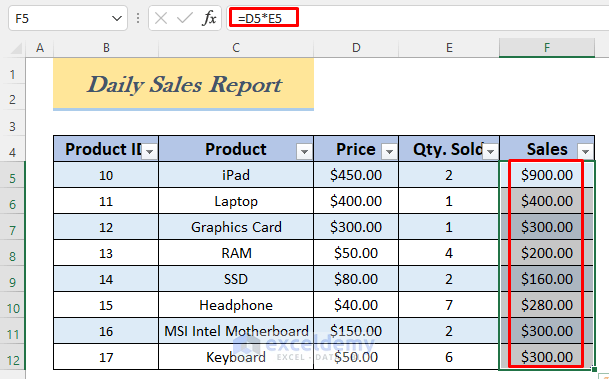
- The company sells electronic devices. We entered some electronic devices, their prices, and sold quantity.
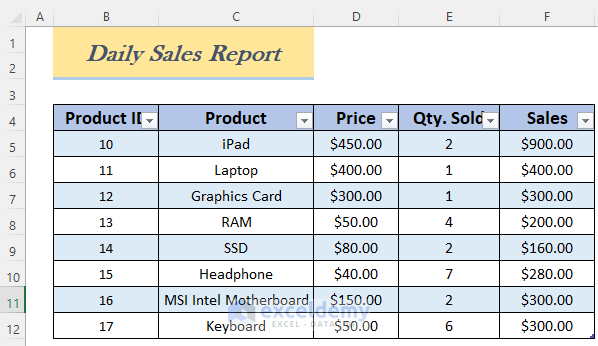
- Insert the following formula to calculate the sales amounts of individual products in column F.
=D5*E5
- To find out the total sales and total items sold, make some modifications and use the following formula in cell E2.
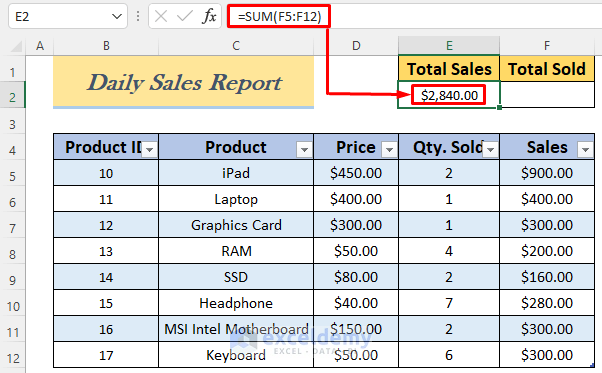
=SUM(F5:F12)
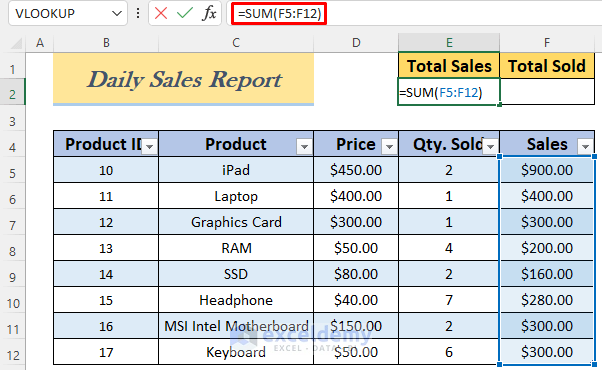
- Press the Enter button and you will see daily total sales.
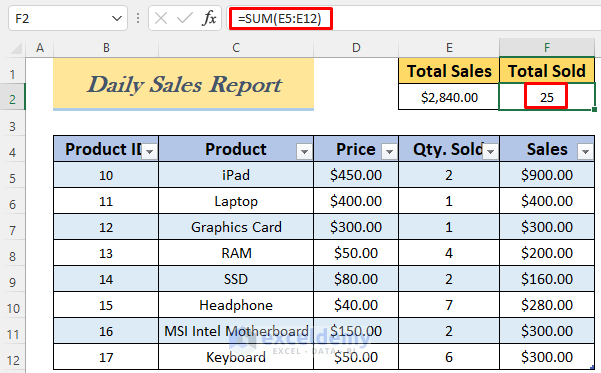
- Use the following formula in cell F2 and press Enter. You will see the total quantity sold in F2.
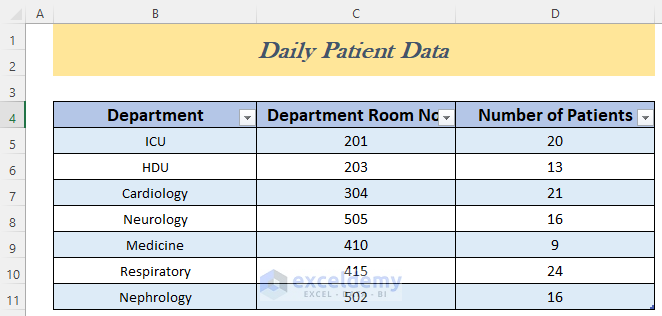
Example 4 – Making a Daily Activity Report for Hospital Entries
Steps:
- Create a table like the following picture and add columns if you need to put other information.
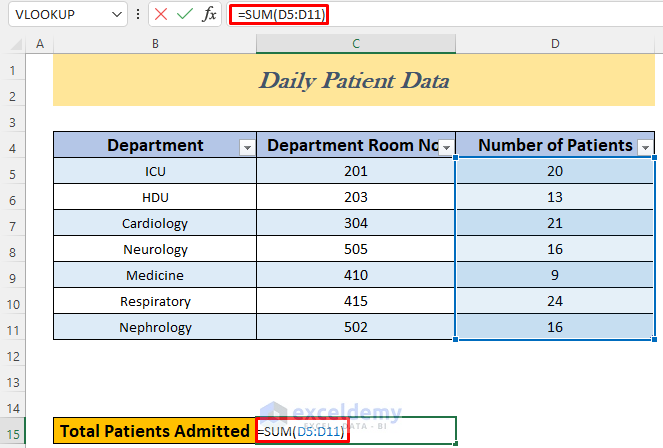
- If you want to see the total patients admitted, use the following formula.
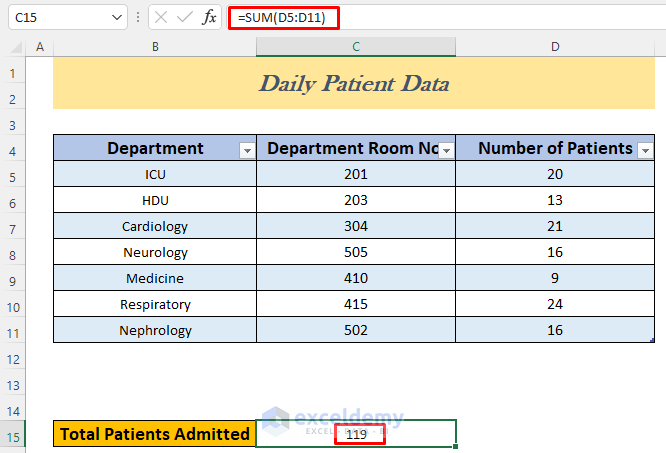
=SUM(D5:D11)
- Hit Enter and you will see the number of the total patients.
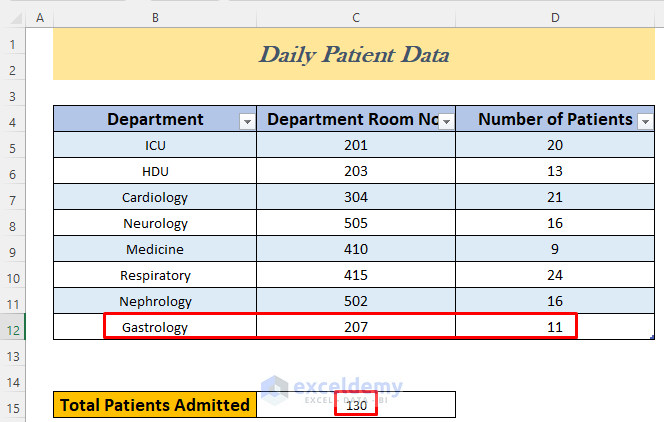
- If you put a new entry, you will see the number of total patients automatically changes.
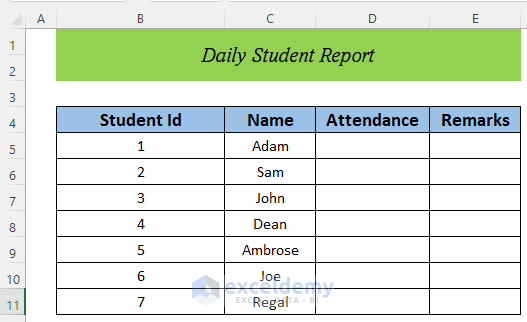
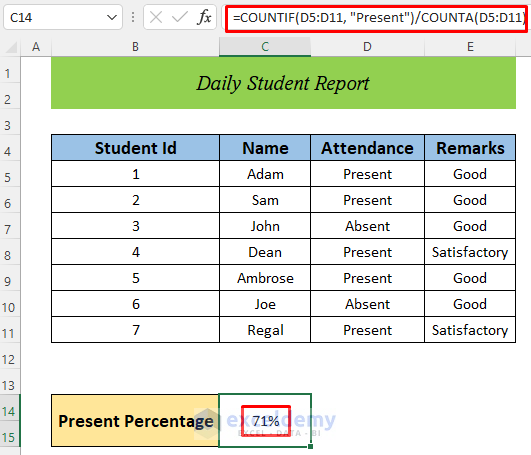
Example 5 – Daily Activity Report for a School
Steps:
- Make an Excel chart like the following image.
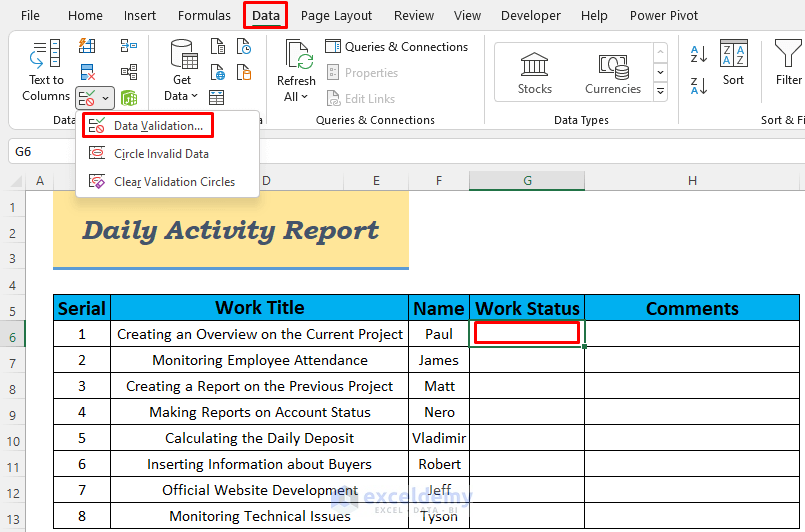
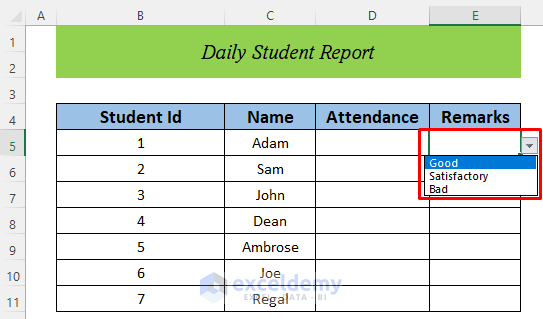
- Make drop-down lists in both the Attendance and Remarks.
- To create a drop-down list with Data Validation, follow the process in Example 1.
- We chose Present and Absent options for the Attendance column.
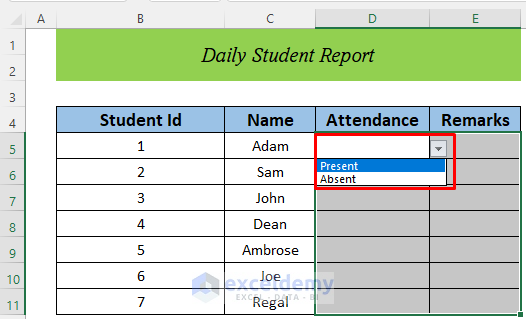
- Use the drop-down list to fill the cells according to the student activities.
- To see the percentage of present students, use the following formula.
=COUNTIF(D5:D11, "Present")/COUNTA(D5:D11)
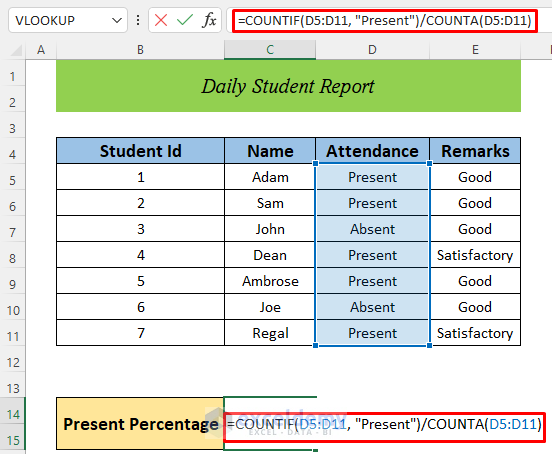
- Press the Enter button and you will see the attendance percentage.
Practice Section
Use the download file with sample datasets to practice with the templates.
Download the Practice Workbook
Daily Activity Report.xlsx
Related Articles
- How to Create an Expense Report in Excel
- How to Create an Income and Expense Report in Excel
- How to Make Production Report in Excel
- How to Make Monthly Report in Excel
- How to Make a Monthly Expense Report in Excel
